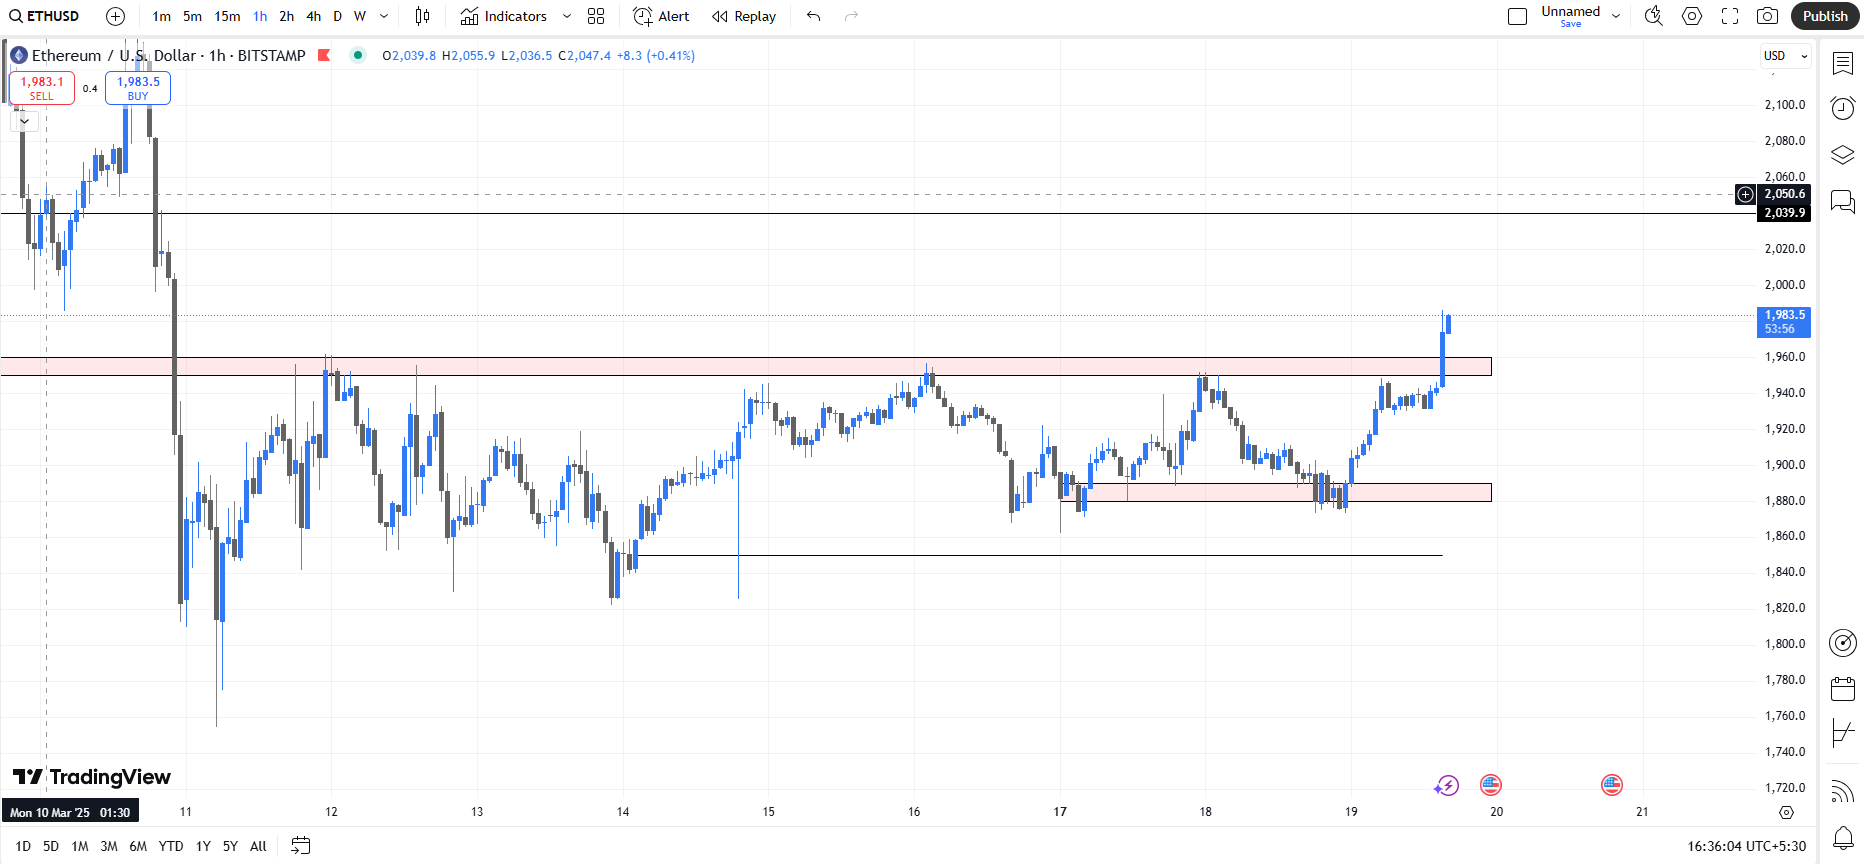
ETHUSD (1H Chart)
Ethereum (ETH/USD) has broken through a key resistance zone, showing bullish momentum.
by Heddge Capitals19 March 2025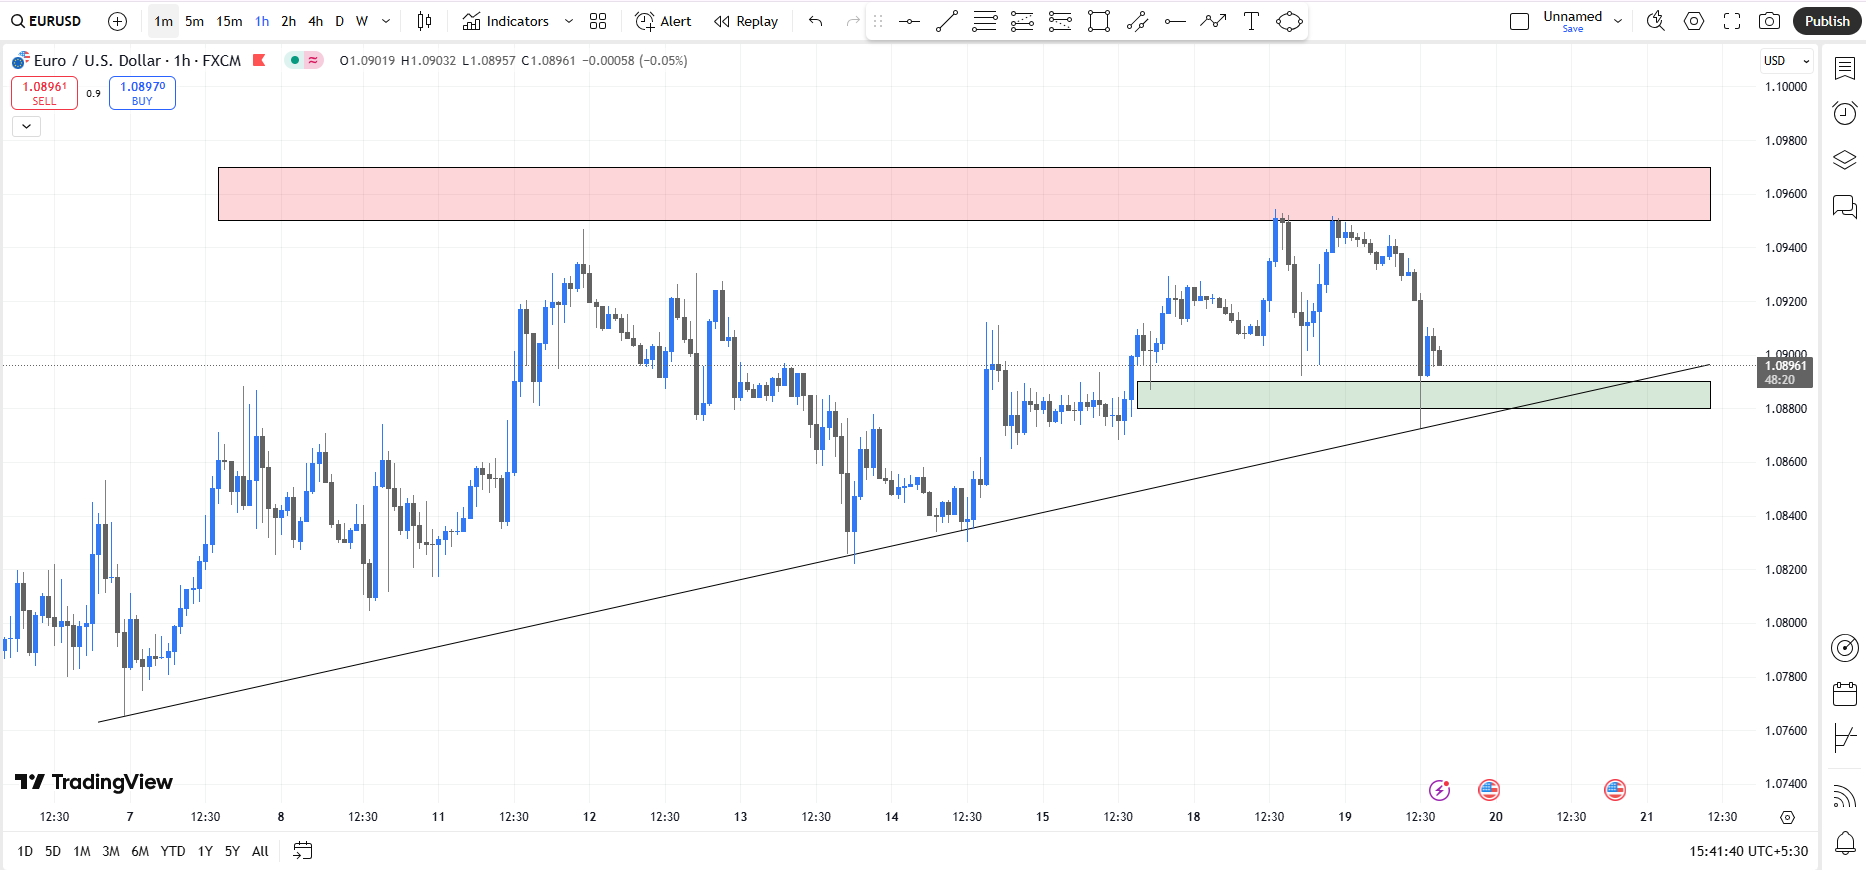
EURUSD (1H Chart)
The price is currently in an overall bullish structure, with higher highs (HH) and higher lows (HL) forming along the ascending trendline.
by Heddge Capitals19 March 2025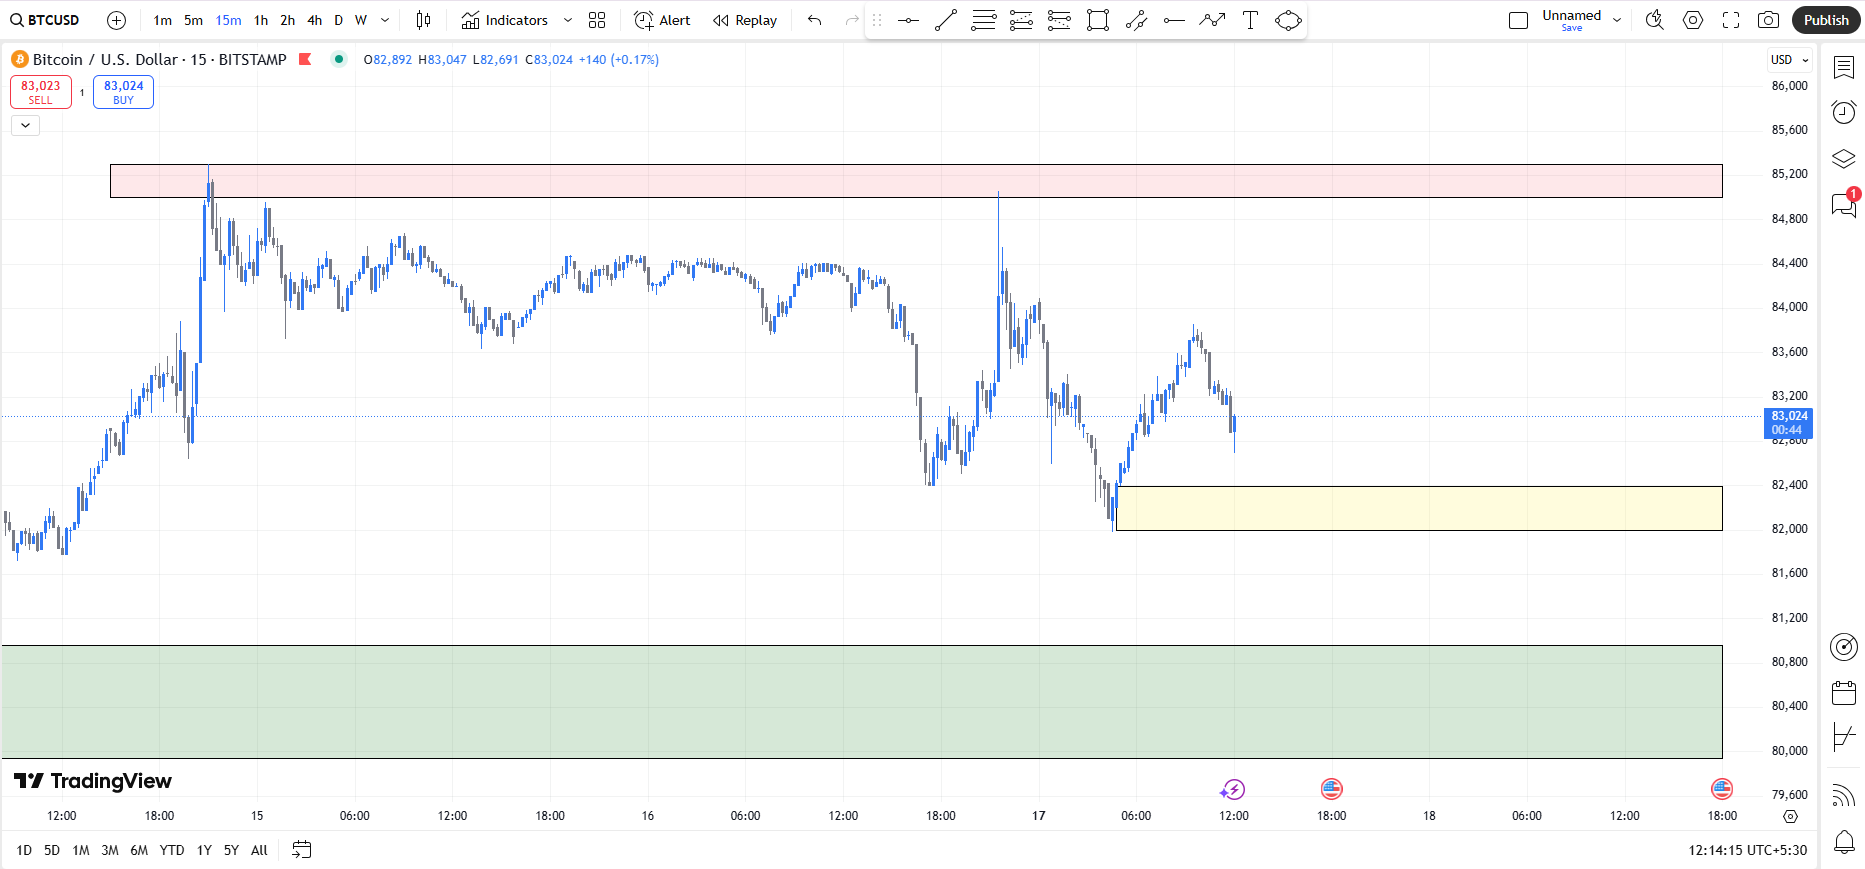
BTCUSD (15M Chart)
BTC is in a range-bound market with a potential shift in order flow.
by Heddge Capitals17 March 2025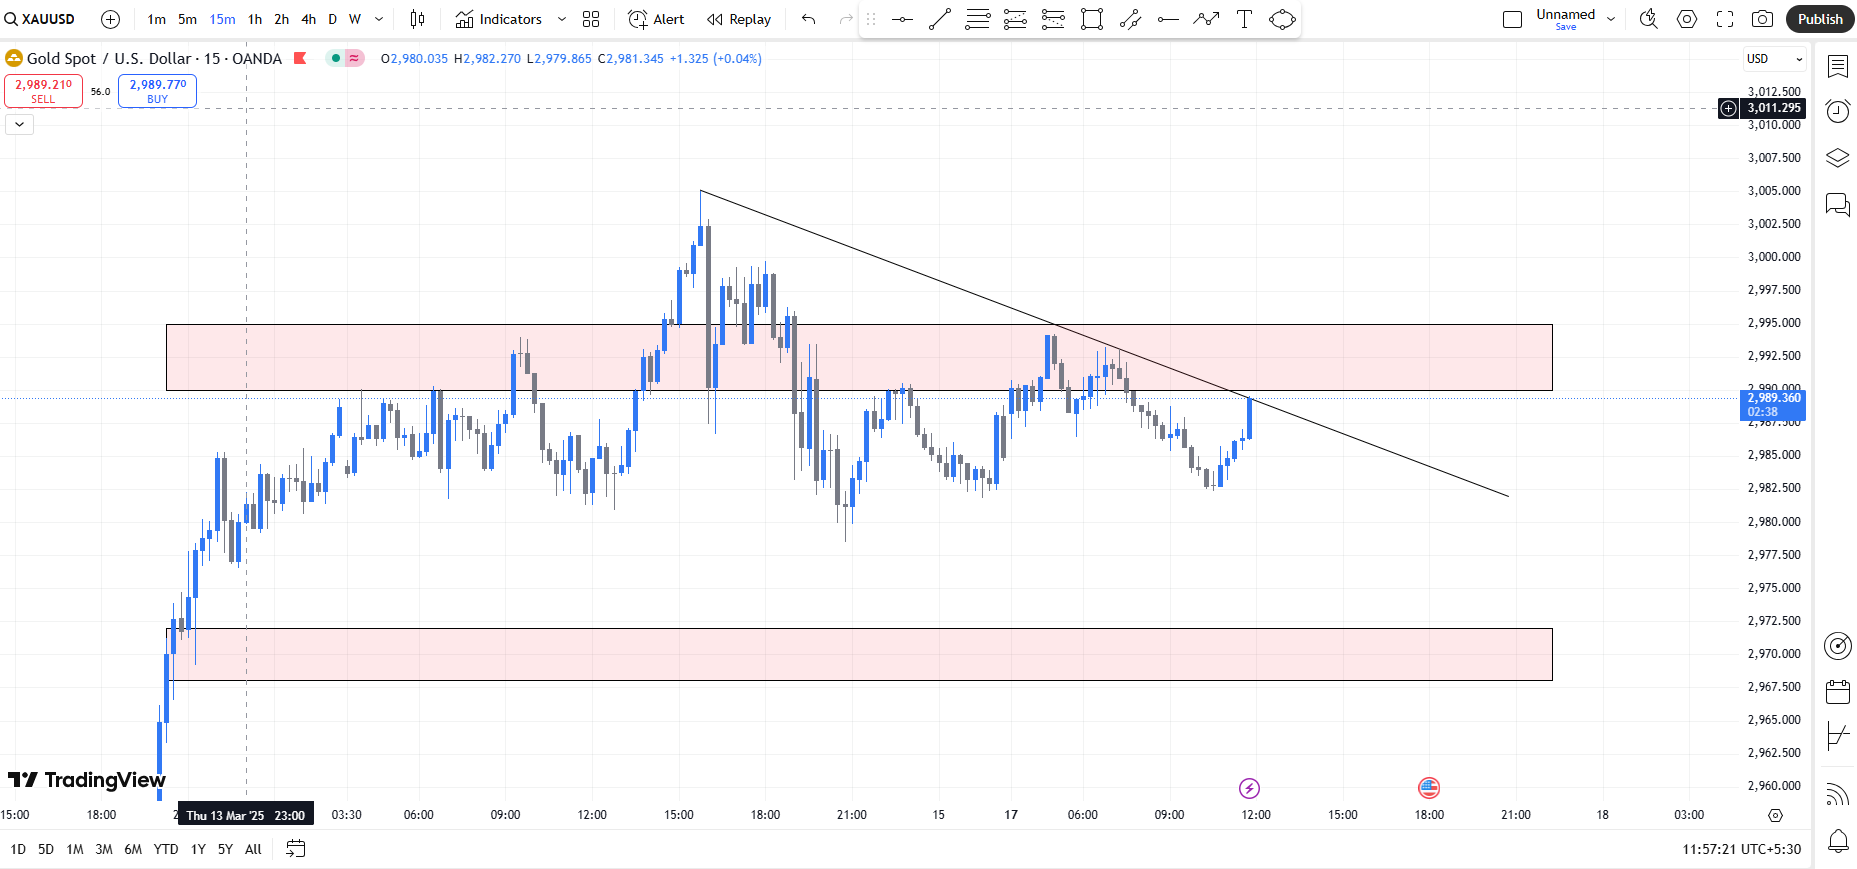
XAUUSD (15M Chart)
Price is respecting a downward sloping trendline, indicating short-term bearish pressure.
by Heddge Capitals17 March 2025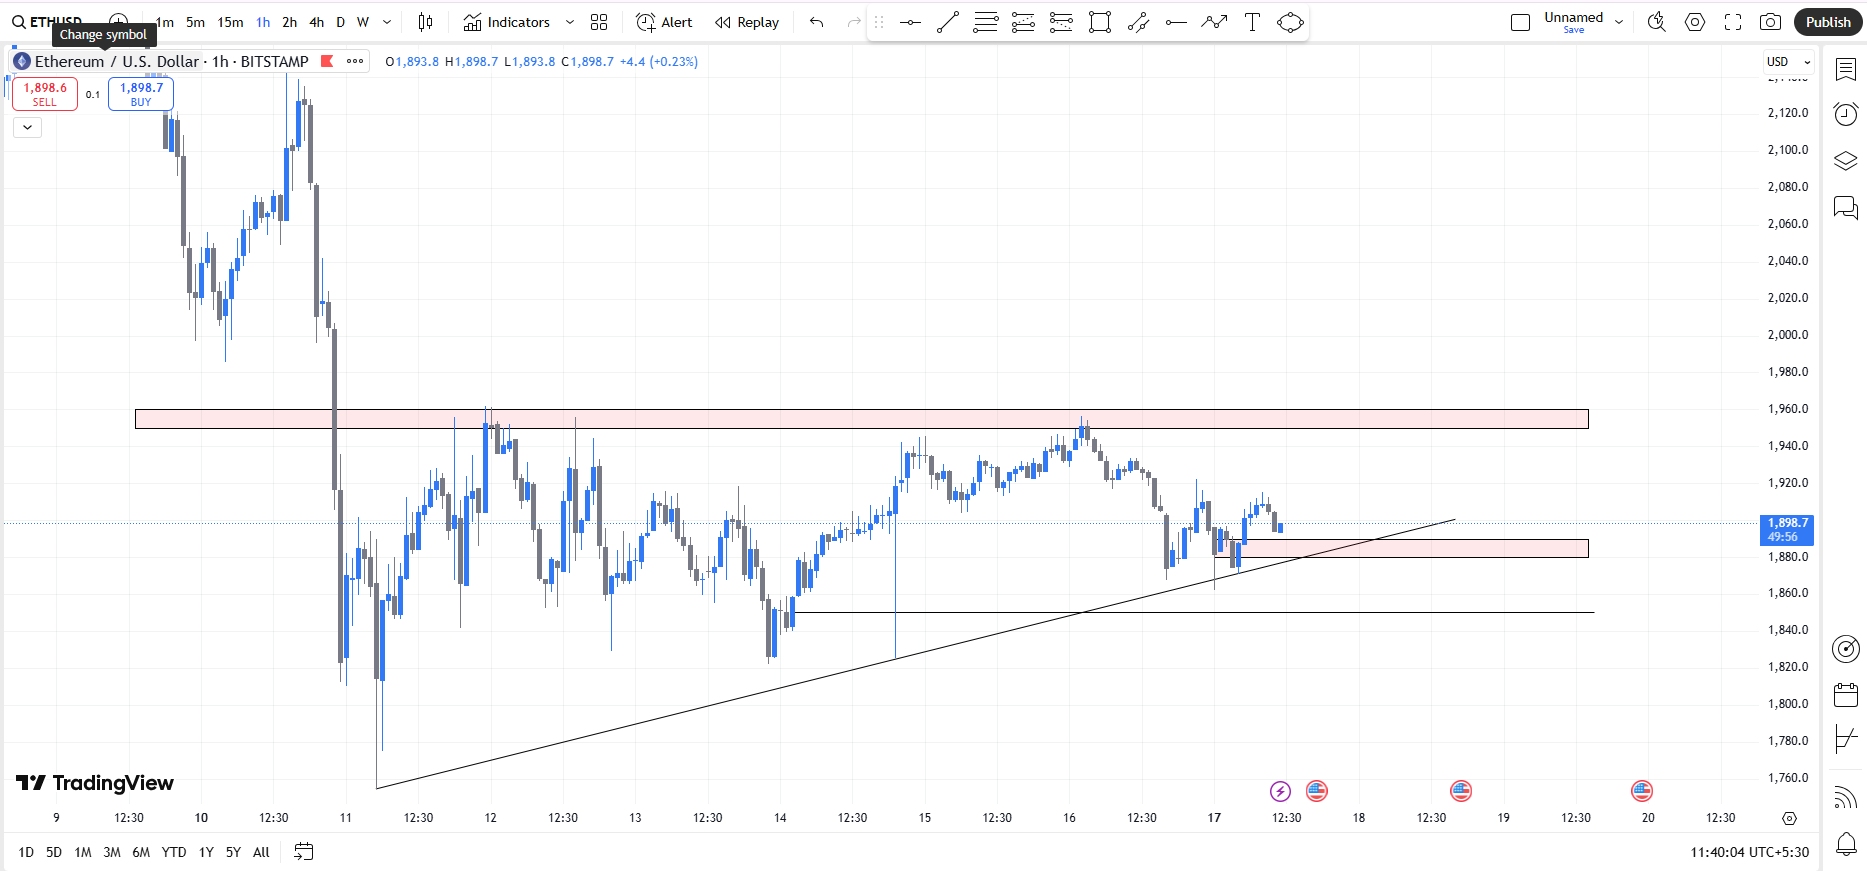
ETHUSD (1H Chart)
ETH is forming higher lows while facing resistance near $1,959.
by Heddge Capitals17 March 2025
XAUUSD (15M Chart)
The price is in a clear bullish structure, forming higher highs and higher lows.
by Heddge Capitals13 March 2025
BTCUSD (1H Chart)
This chart is marked with supply & demand zones, support & resistance levels, and potential trade setups.
by Heddge Capitals13 March 2025
XAUUSD (1H Chart)
The market is in an uptrend, confirmed by the ascending trendline.
by Heddge Capitals13 March 2025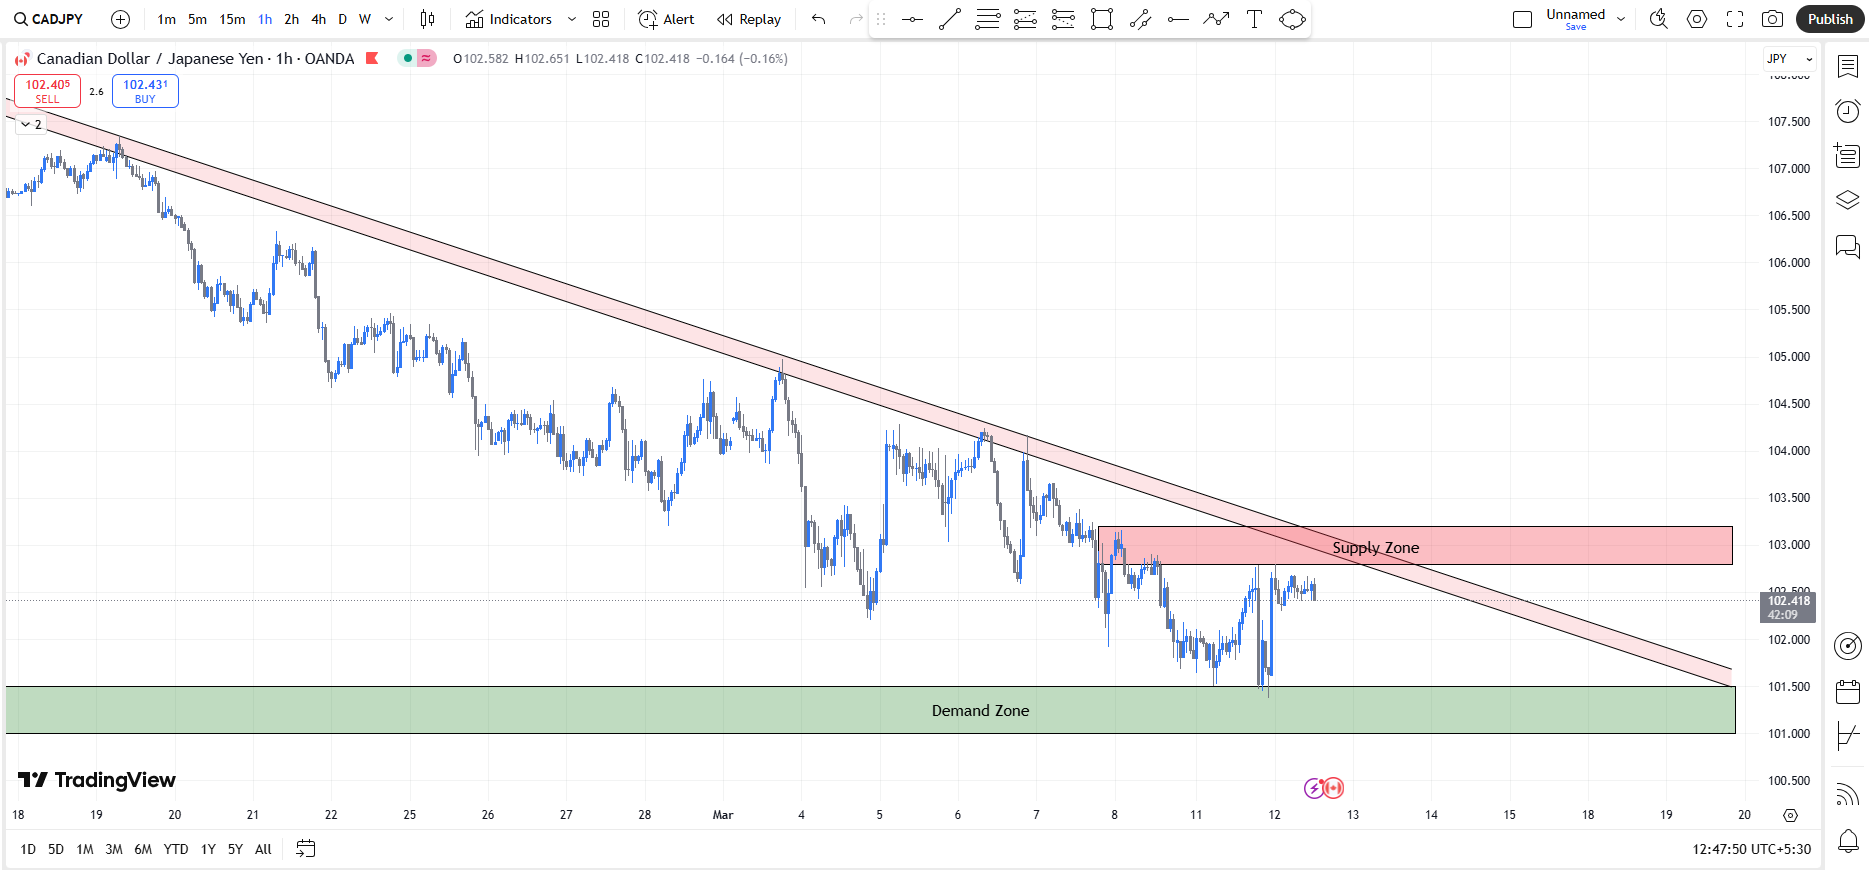
CADJPY (2H Chart)
The price is still in a clear downtrend, respecting the descending trendline (acting as dynamic resistance).
by Heddge Capitals12 March 2025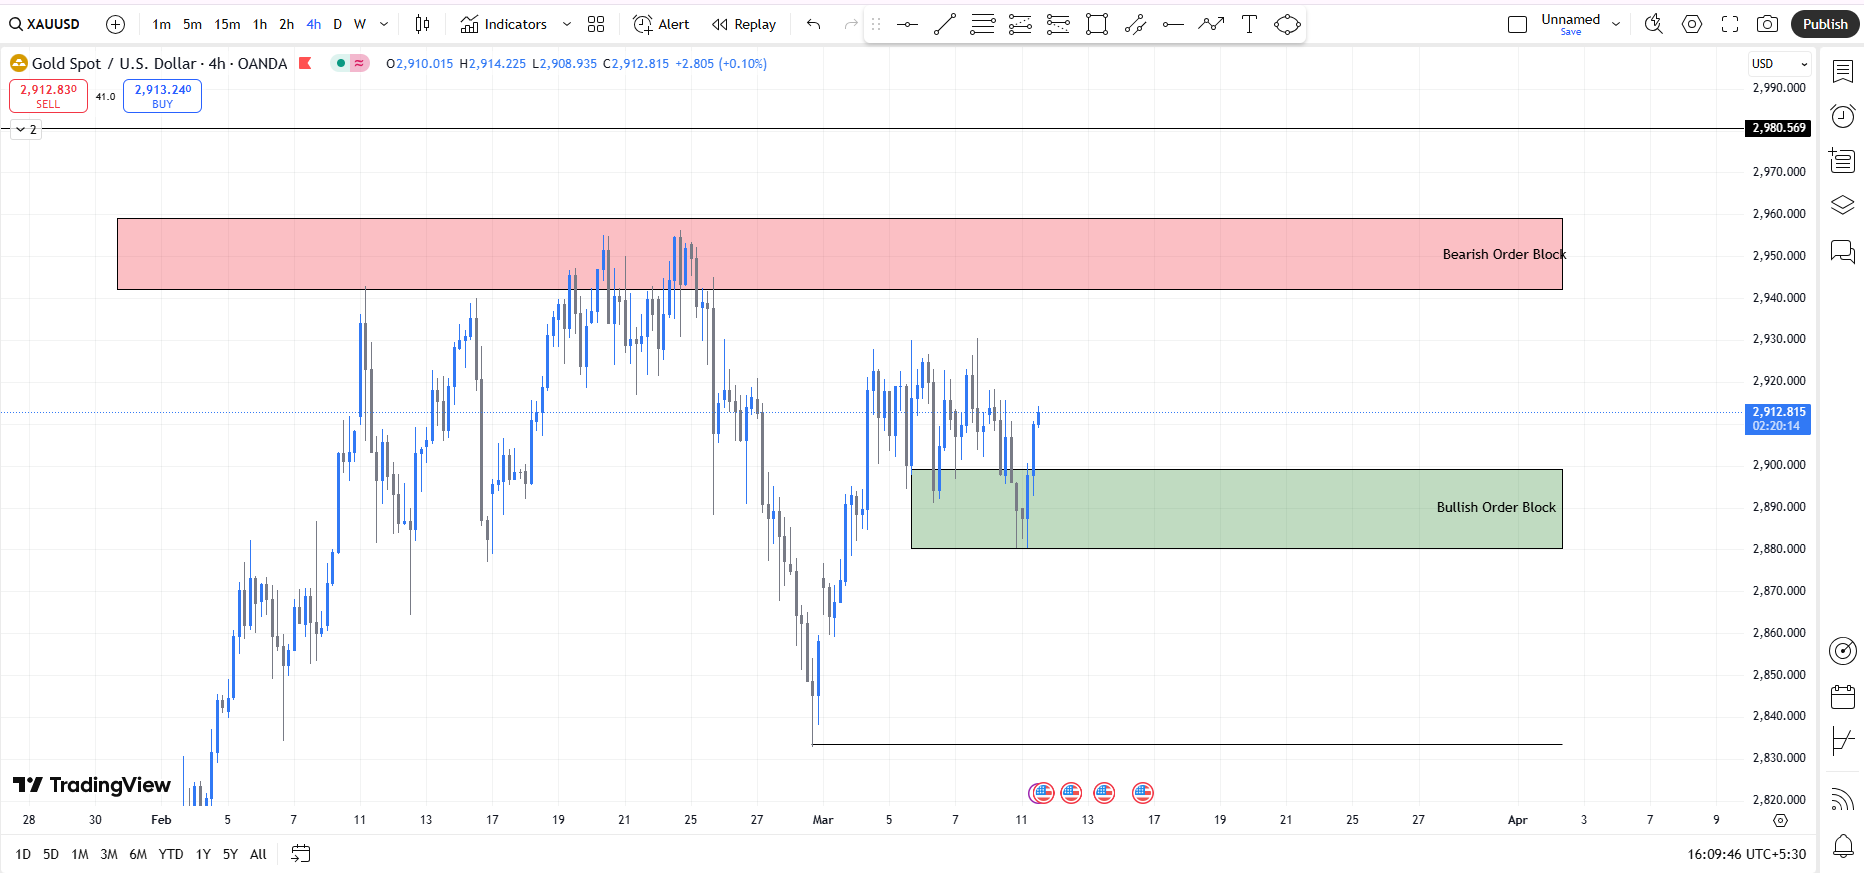
XAUUSD (4H Chart)
Strong bullish momentum from mid-January to early March, forming higher highs and higher lows.
by Heddge Capitals11 March 2025
BTCUSD (4H Chart)
Strong bearish decline from above $96,000 to nearly $78,000.
by Heddge Capitals11 March 2025
EURUSD (4H Chart)
Strong bullish trend with consecutive higher highs and higher lows.
by Heddge Capitals11 March 2025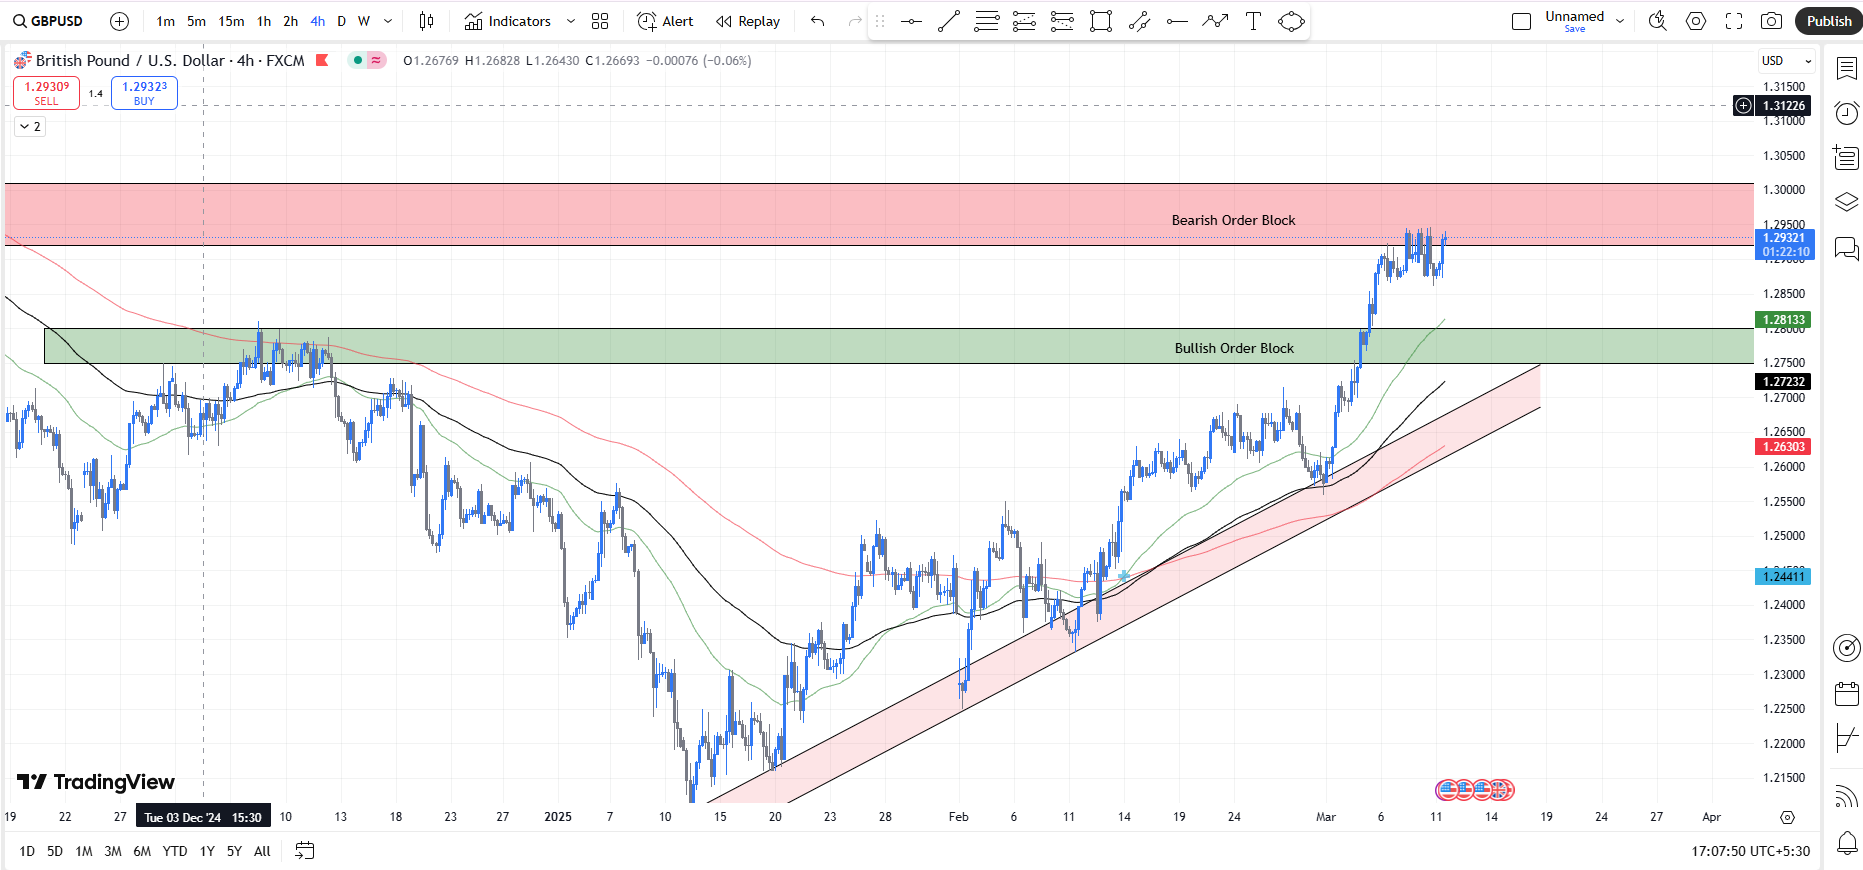
GBPUSD (4H Chart)
GBP USD is in a strong bullish uptrend, forming higher highs and higher lows.
by Heddge Capitals11 March 2025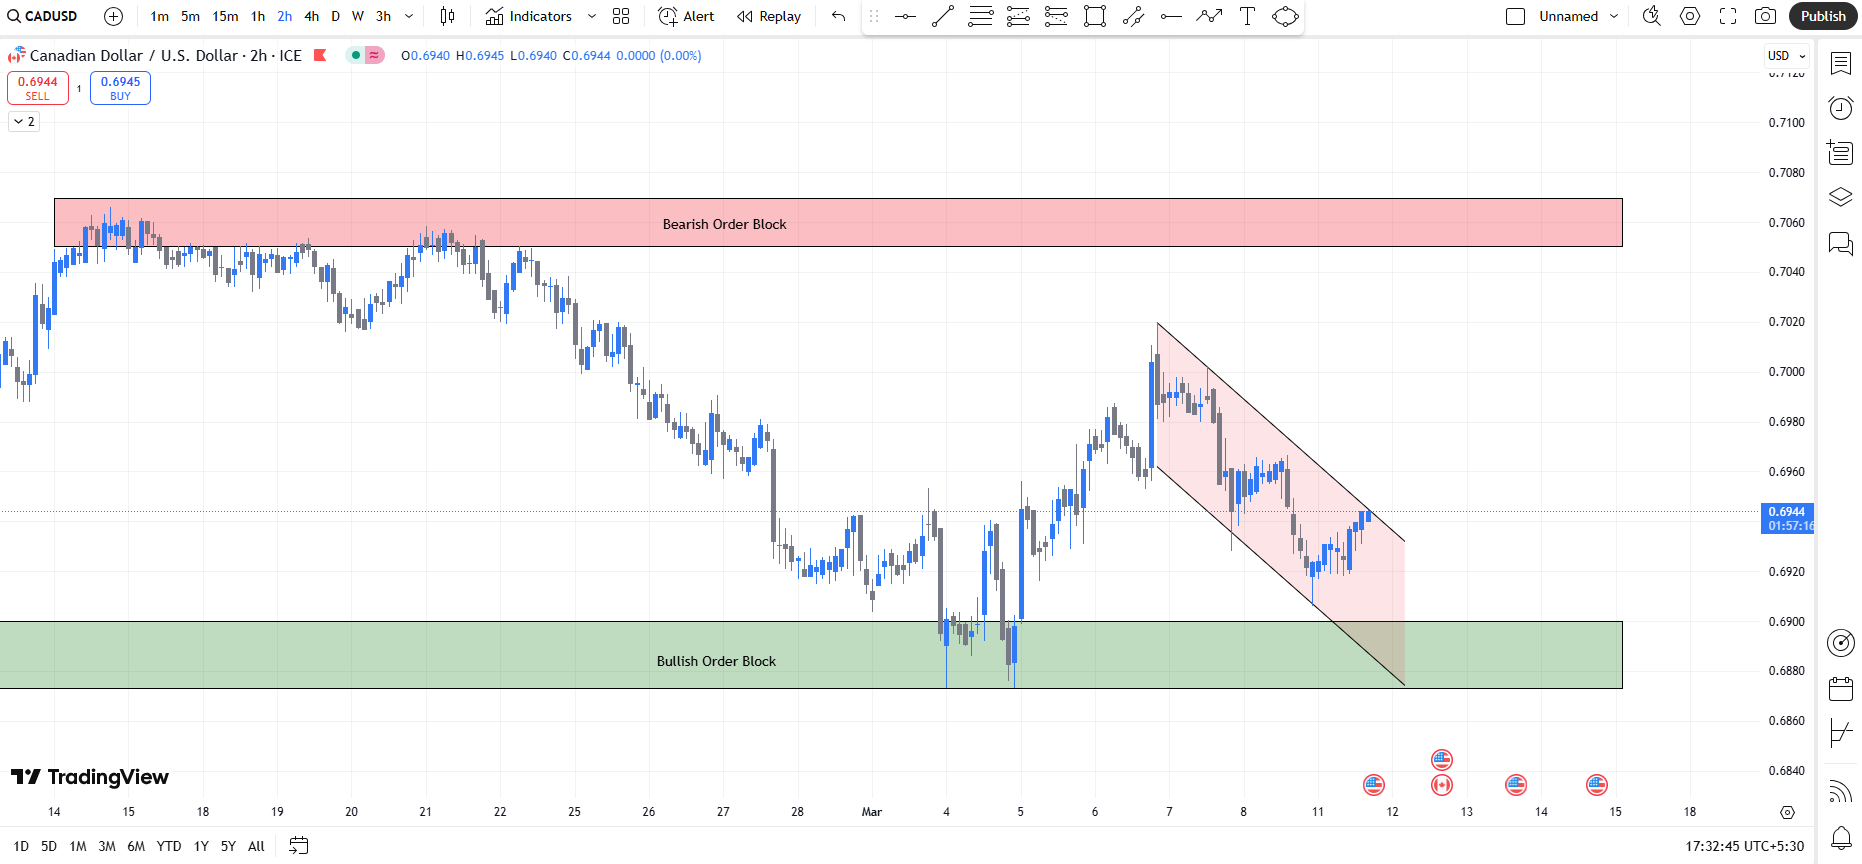
CADUSD (4H Chart)
Short-term bearish with a descending channel.
by Heddge Capitals11 March 2025