BTCUSD (1H Chart)
This chart is marked with supply & demand zones, support & resistance levels, and potential trade setups. Below is a detailed breakdown of the price action.
Analysis :
Market Structure
Previous Downtrend → Current Recovery
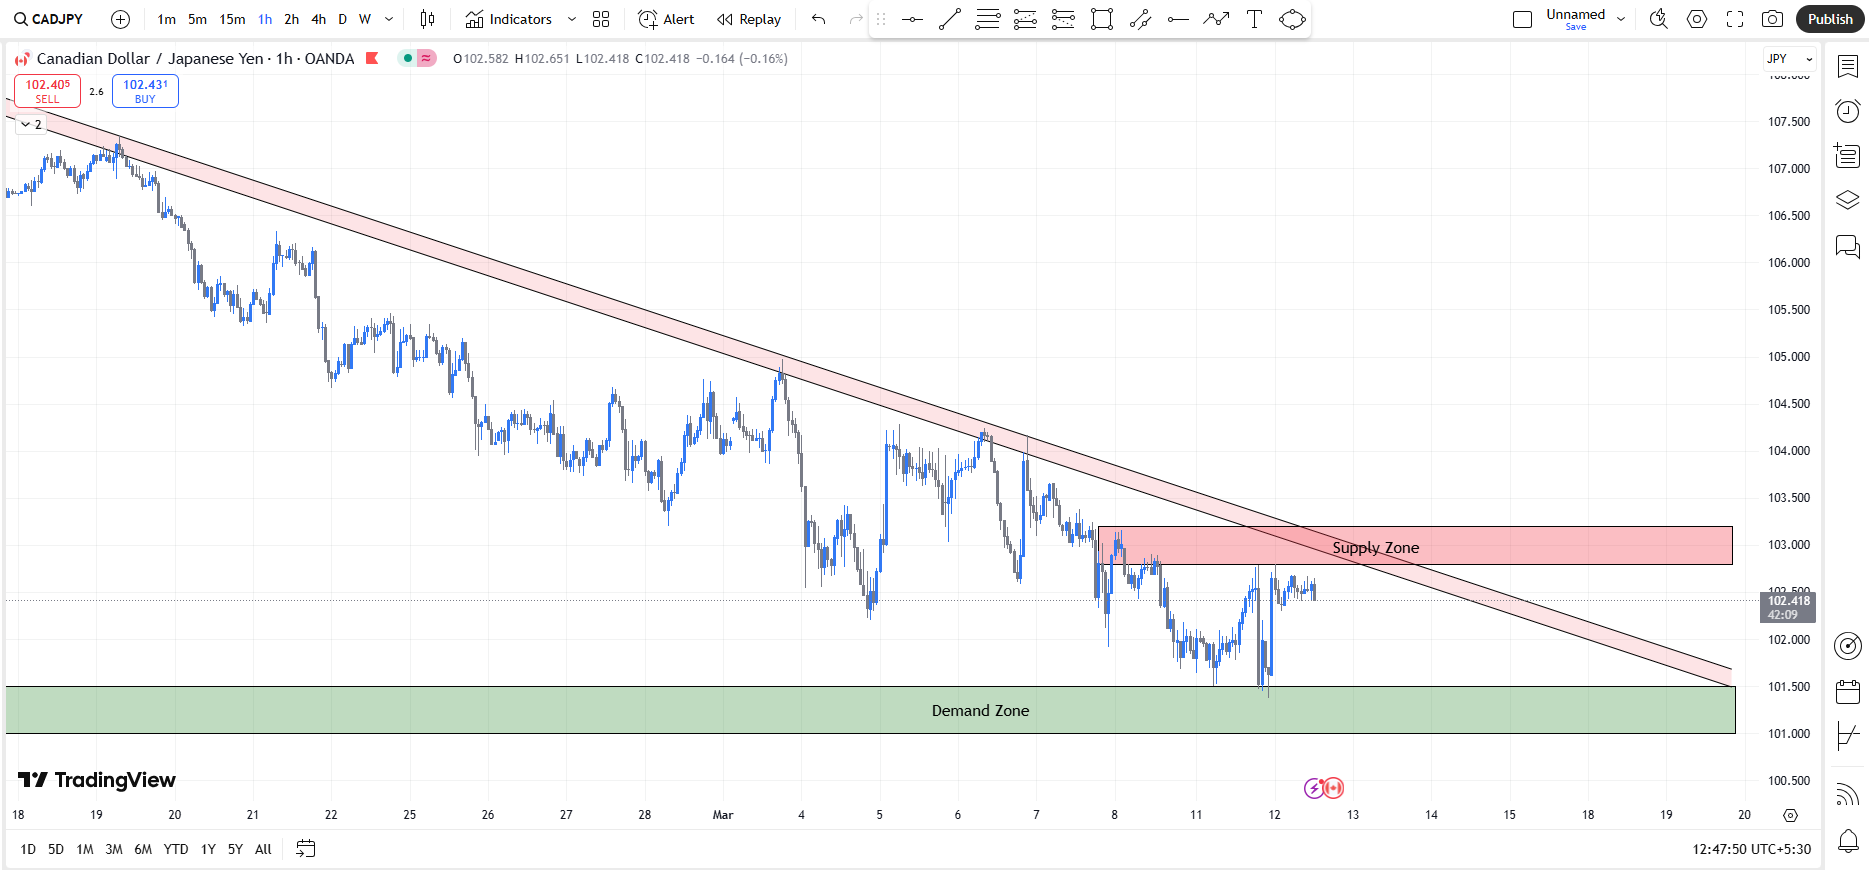
Bitcoin recently experienced a strong bearish drop, followed by a consolidation and recovery phase.
Price is currently bouncing between a supply zone (resistance) and a demand zone (support).
Key Supply & Demand Zones
- Supply Zones (Resistance - Potential Sell Areas) 86,000 - 87,000 (Major Supply Zone in Red)
- Demand Zones (Support - Potential Buy Areas) 76,500 - 77,500 (Major Demand Zone - Black Box)
Trading Plan
Bullish Scenario (Buy Setup)
- Entry: If price holds above 81,000 (support zone).
- Confirmation: Look for bullish reactions (e.g., rejection wicks or bullish engulfing candles).
Bearish Scenario (Sell Setup)
- Entry: If price rejects from the 83,500 - 84,500 supply zone and fails to break above.
- Confirmation: Look for bearish signals (e.g., rejection wicks, bearish engulfing, or lower highs).
Happy Trading!
Note: This analysis is for educational and informational purposes only and should not be considered financial advice. Trading in Forex, commodities, and indices involves a high level of risk and may not be suitable for all investors. Before engaging in live trading, ensure you have a clear risk management strategy and consult a licensed financial advisor if necessary. You are responsible for your trading decisions.