ETHUSD (1H Chart)
Analysis :
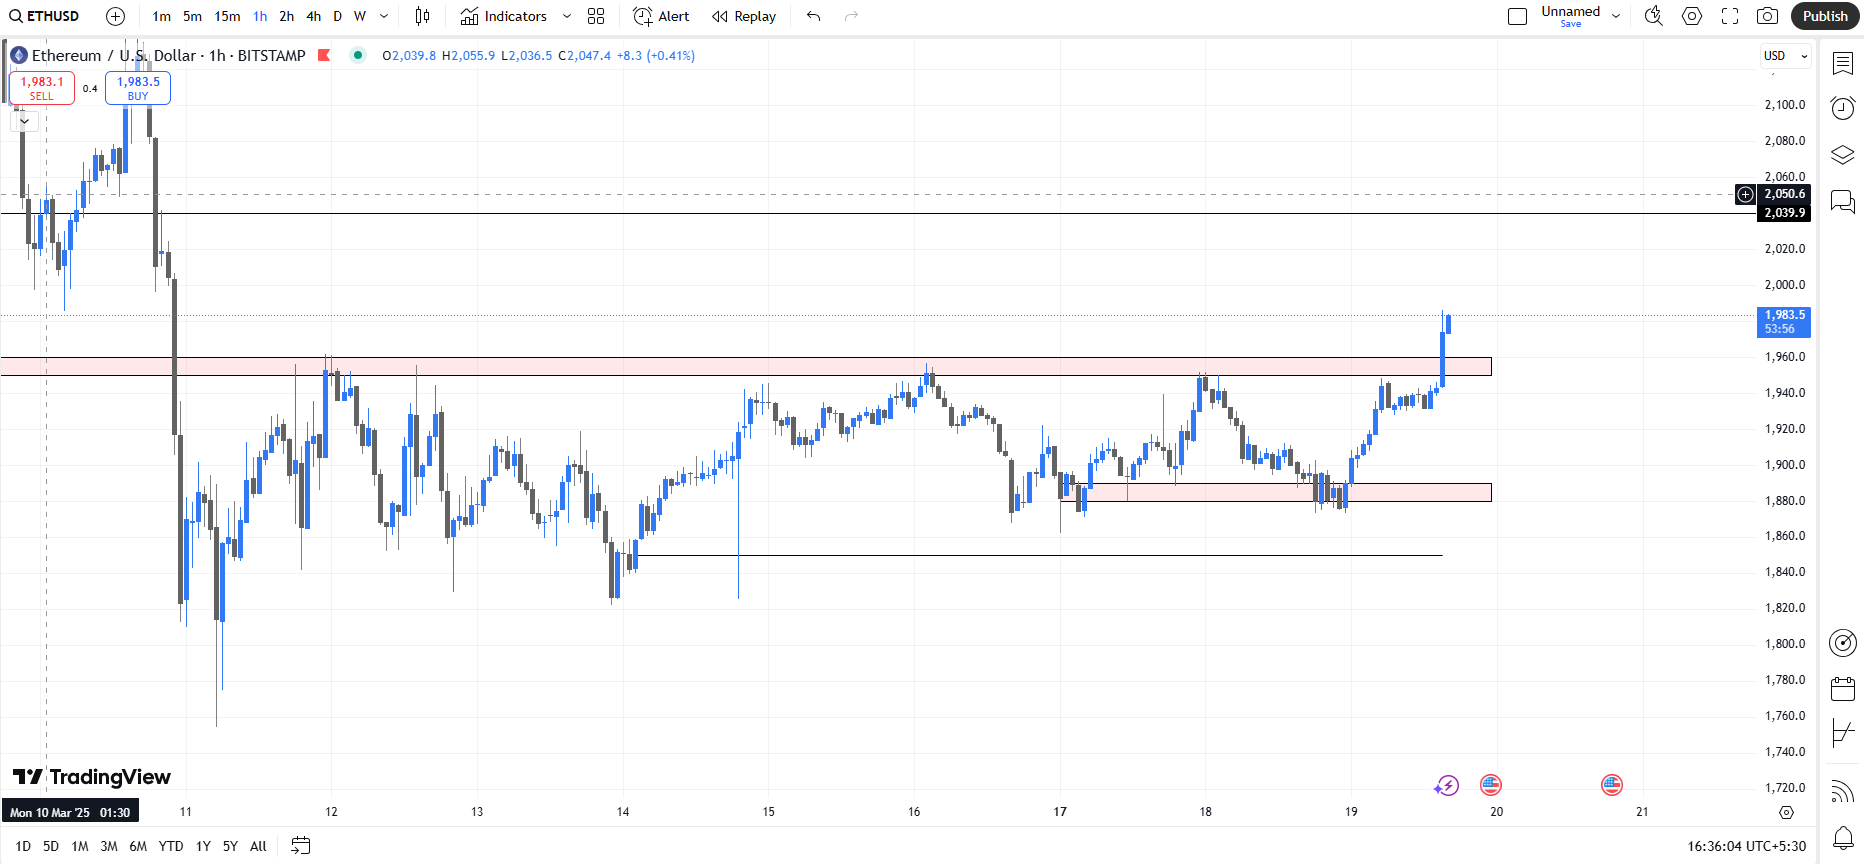
Market Structure
Ethereum (ETH/USD) has broken through a key resistance zone, showing bullish momentum.
Next Major Resistance: The next key level for price action is around 2,044, as seen in historical price movements.
Liquidity Analysis
- Liquidity Grab at 1,880: Before this strong bullish move, price swept liquidity from the 1,880 - 1,900 demand zone.
- Buy-Side Liquidity Above 1,960 Taken: The breakout above 1,960 - 1,980 suggests that institutional players have targeted buy-side liquidity.
- Next Liquidity Pool at 2,044: If price holds above 1,960, the next liquidity zone is around 2,044.
Order Blocks (OB) & Fair Value Gaps (FVG)
- Bullish Order Block: Around 1,880 - 1,900, where price found support before launching upwards.
- Bearish Order Block (Potential Reversal Zone): 1,960 - 1,980 was previously a supply zone, but price has broken through.
- Fair Value Gap (FVG): A potential imbalance exists between 1,920 - 1,940, and price might retrace slightly before continuing higher.
Happy Trading!
Note: This analysis is for educational and informational purposes only and should not be considered financial advice. Trading in Forex, commodities, and indices involves a high level of risk and may not be suitable for all investors. Before engaging in live trading, ensure you have a clear risk management strategy and consult a licensed financial advisor if necessary. You are responsible for your trading decisions..