BTCUSD (15M Chart)
Analysis :
Market Structure
This analysis is for educational and informational purposes only and should not be considered financial advice. Trading in Forex, commodities, and indices involves a high level of risk and may not be suitable for all investors. Before engaging in live trading, ensure you have a clear risk management strategy and consult a licensed financial advisor if necessary. You are responsible for your trading decisions.
Key Structural Levels:
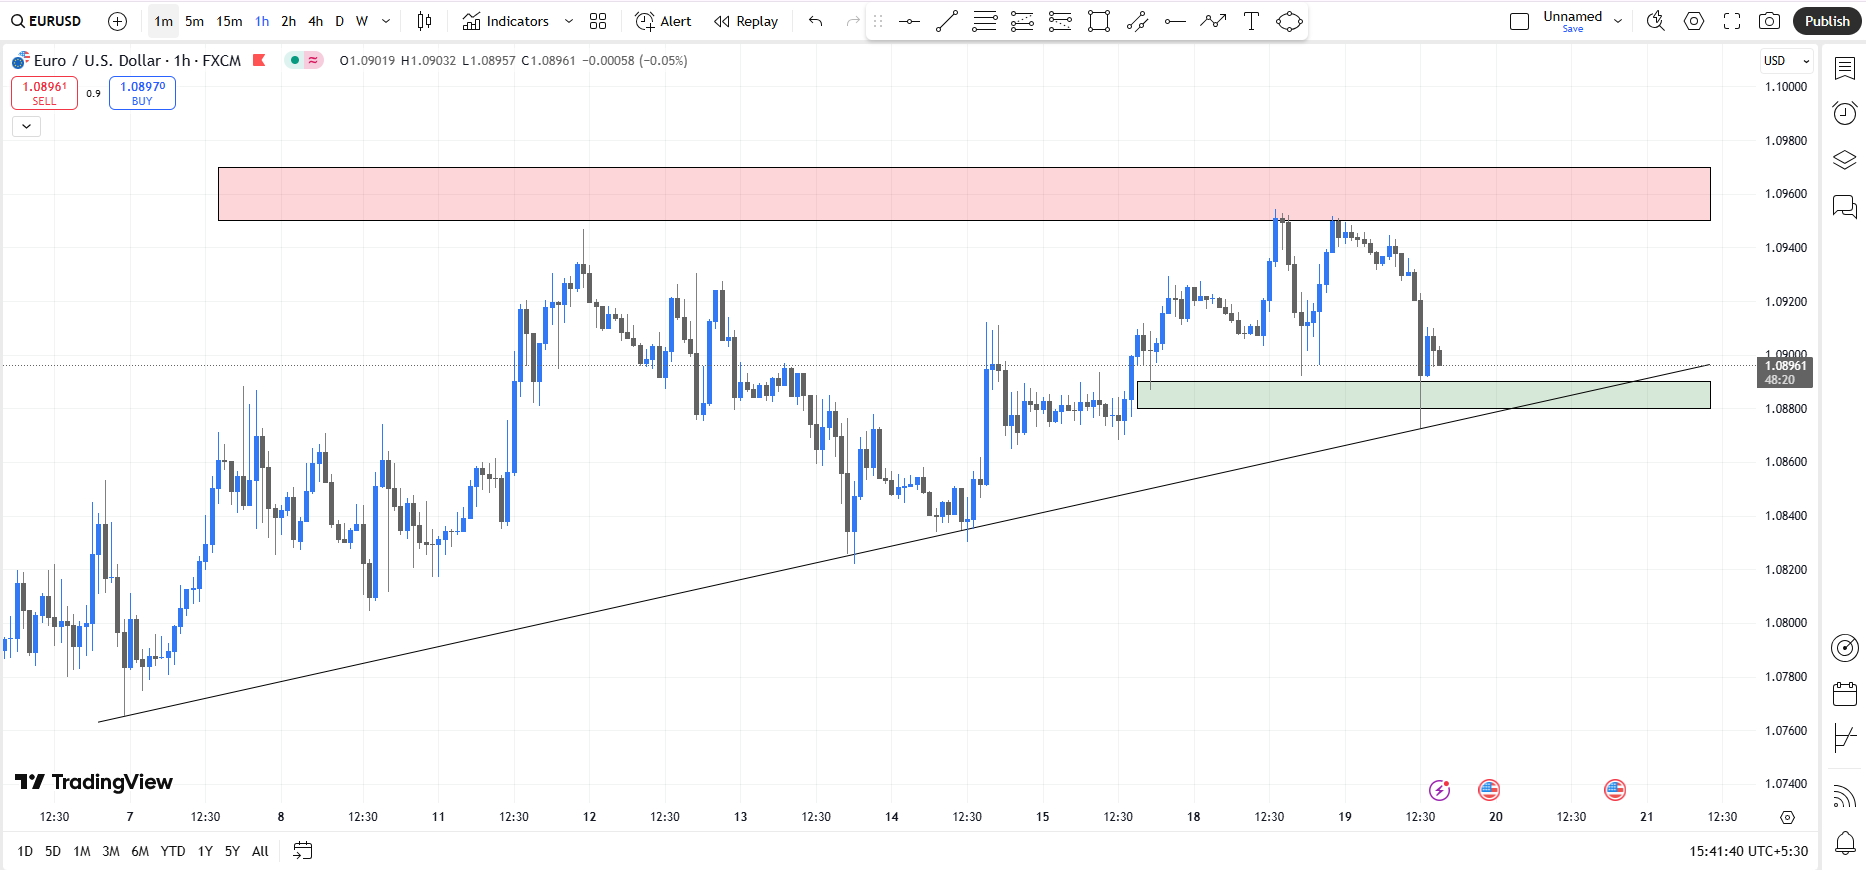
- Bullish Break of Structure (BOS): Occurred around 1.0950 - 1.0970.
- Bearish Break of Structure (BOS): Would happen if price breaks below 1.0880.
Liquidity Analysis
- Liquidity Grab at Support: The recent sharp move down into the demand zone (highlighted in yellow) might be a stop hunt before moving higher.
- Liquidity above 1.0970: This is a potential target for market makers to take out buy-side liquidity.
- Liquidity below 1.0880: If price breaks this level, it could trigger sell stops and push lower.
Order Blocks (OB) & Fair Value Gaps (FVG)
- Bullish Order Block (OB): The last down candle before the strong bullish move around 1.0880 - 1.0890 (highlighted yellow zone). If price respects this zone, we can expect a bullish move.
- Fair Value Gap (FVG): There's an imbalance around 1.0920 - 1.0935, which price might retrace to fill before continuing higher.
Happy Trading!
Note: This analysis is for educational and informational purposes only and should not be considered financial advice. Trading in Forex, commodities, and indices involves a high level of risk and may not be suitable for all investors. Before engaging in live trading, ensure you have a clear risk management strategy and consult a licensed financial advisor if necessary. You are responsible for your trading decisions.