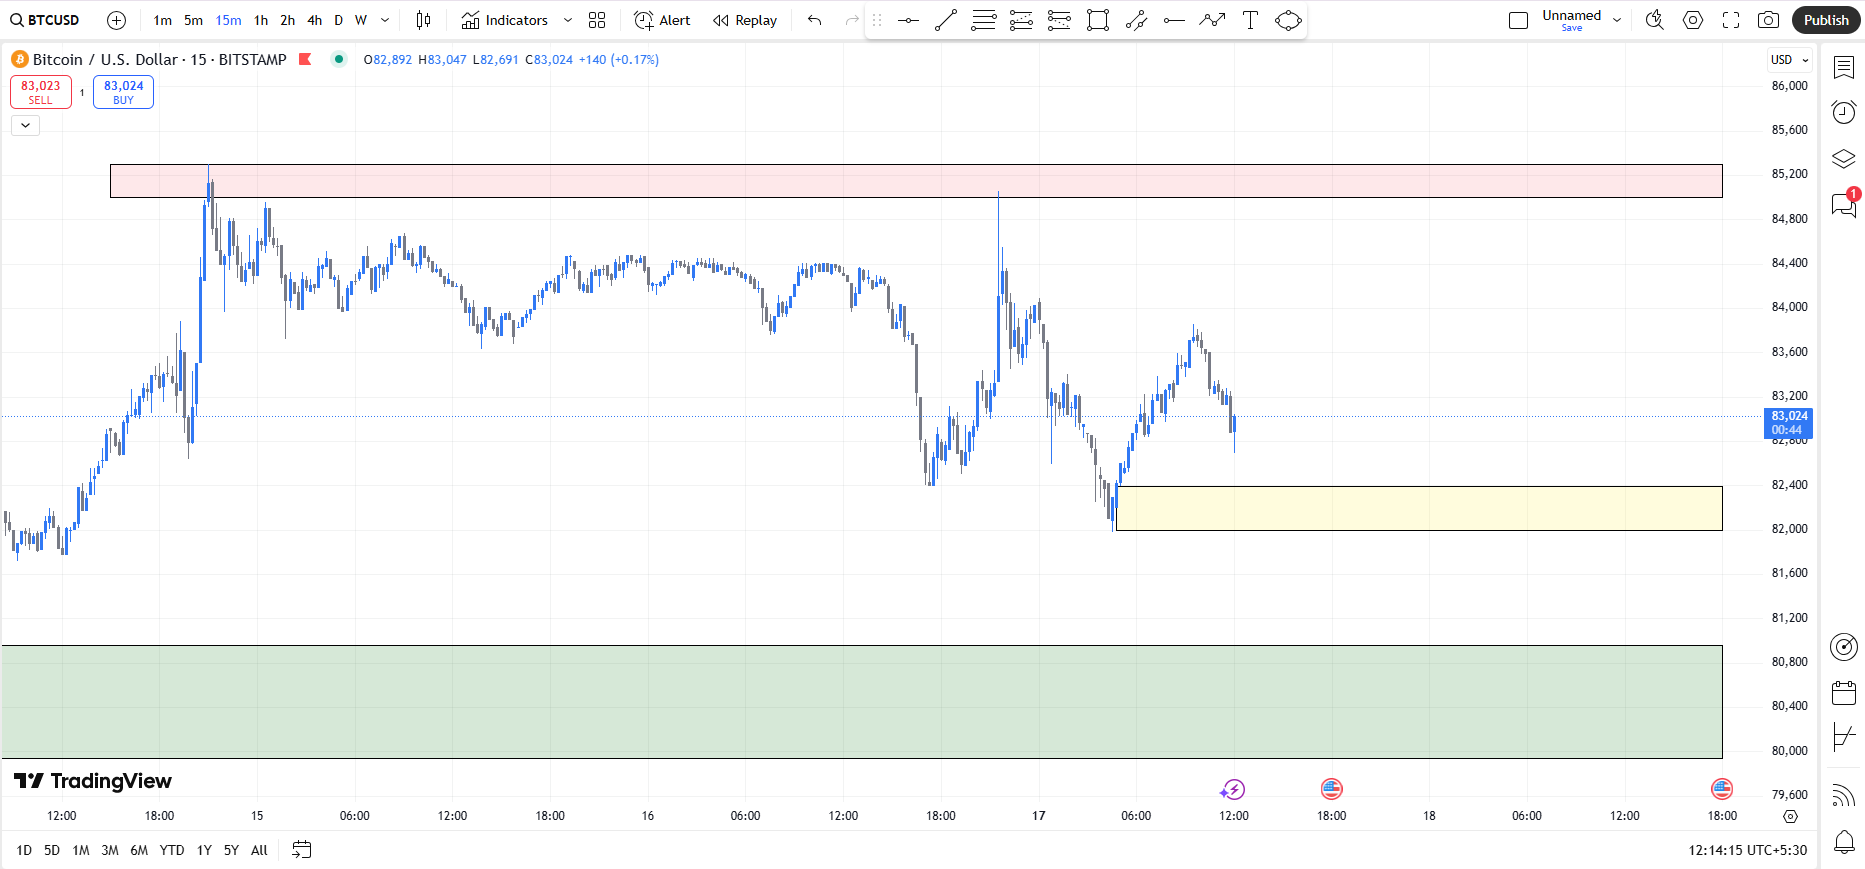
BTCUSD (15M Chart)
Analysis :
Market Structure
- Current Trend : BTC is in a range-bound market with a potential shift in order flow.
Recent High & Low
- Swing High : Around $85,300 (liquidity zone)
- Swing Low : Near $80,000 (potential demand zone)
- Internal Structure : Price is consolidating between a premium supply zone and a discount demand zone.
Liquidity Zones
Buy-Side Liquidity
Located above $85,300, where liquidity is trapped from short-sellers’ stop losses.
If price breaks above, a liquidity grab (fakeout) may occur before a reversal or continuation.
Sell-Side Liquidity
Found below $80,000, where long positions have stop losses.
If price sweeps this area, it could trigger a liquidity grab before a bullish move.
Order Blocks
Bearish Order Block (Supply Zone)
$85,000 - $85,300 → Last up move before a strong decline.
If price returns to this level and shows weakness, expect a rejection.
If BTC breaks above this OB with momentum, it could lead to a market structure shift (MSS) bullish.
Bullish Order Block (Demand Zone)
$80,000 - $81,000 → Last down move before a rally.
If price taps this OB with bullish confirmations (e.g., a wick rejection), it could signal long entries.
Possible Trade Setups
Bearish Scenario (Liquidity Grab at Supply Zone)
- Entry : Short from $85,000 - $85,300 (after liquidity grab)
- Target : $81,000 - $80,000 (sell-side liquidity sweep)
- Stop Loss : Above $85,500
- Confirmation : Weak reaction at supply zone, rejection wicks, or shift in order flow.
Bullish Scenario
- Entry : Long from $80,000 - $81,000 (demand zone bounce)
- Target : $84,500 - $85,000 (fill FVG & retest supply)
- Stop Loss : Below $79,500
- Confirmation : Bullish order block reaction, liquidity sweep & shift in market structure (higher highs).
Conclusion
- Bearish bias unless $85,300 is broken convincingly.
- Liquidity grab scenarios likely before trend continuation.
- Key decision point: $85,000 supply zone & $80,000 demand zone.
Happy Trading!
Note: This analysis is for educational and informational purposes only and should not be considered financial advice. Trading in Forex, commodities, and indices involves a high level of risk and may not be suitable for all investors. Before engaging in live trading, ensure you have a clear risk management strategy and consult a licensed financial advisor if necessary. You are responsible for your trading decisions.