XAUUSD (15M Chart)
Analysis :
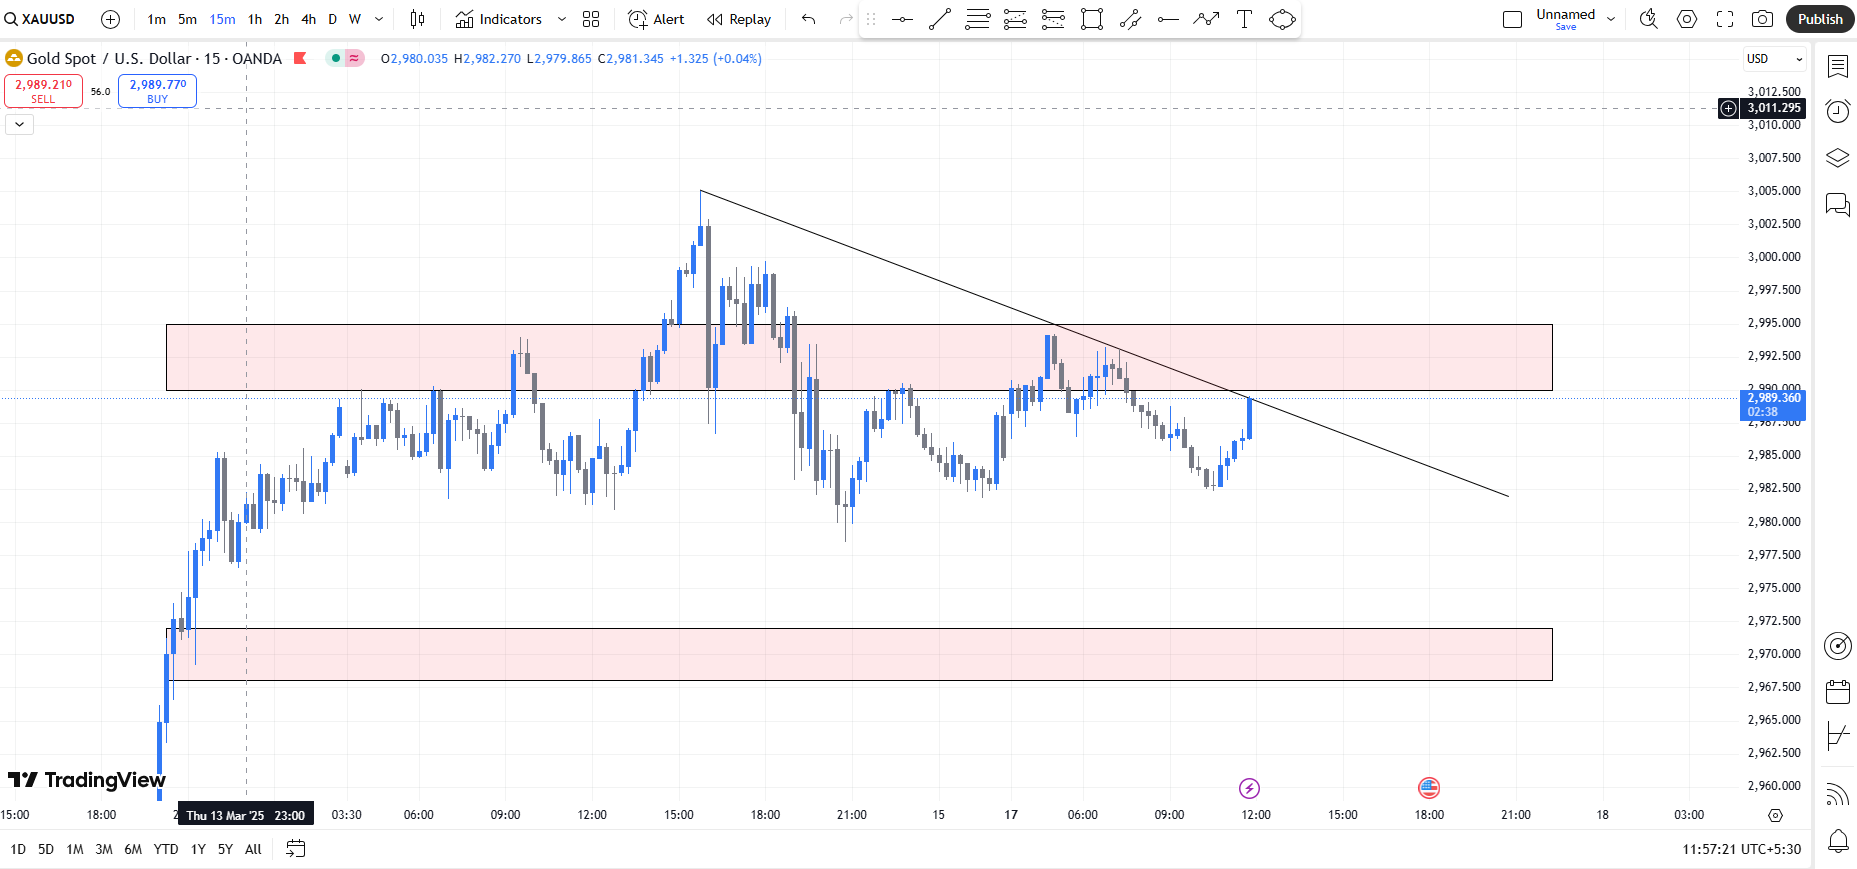
Market Structure
- Ascending Triangle Formation : ETH is forming higher lows while facing resistance near $1,959.
- Descending Trendline Resistance : Price is respecting a downward sloping trendline, indicating short-term bearish pressure.
- Key Resistance at $2,990 - $2,995 : Previous highs acted as strong resistance.
- Demand Zone at $2,968 - $2,972 : A major support zone where buyers previously stepped in.
Resistance Levels (Sell Zone)
$2,990 - $2,995 → If price breaks above this zone, expect further upside.
$3,000 Psychological Level → If momentum continues, this would be the next key target.
Support Levels (Buy Zone)
$2,968 - $2,972 → Immediate support; if price retraces, buyers may enter here.
$2,950 - $2,955 → Stronger demand zone in case of a deeper pullback.
Possible Trade Scenarios
Bullish Breakout (High Probability)
If XAU/USD breaks and closes above the trendline (~$2,988-$2,990), expect a push to $3,000+.
Confirmation: Strong bullish candle closing above resistance.
Bearish Rejection (Medium Probability)
If gold fails to break the trendline, price could drop back to $2,968 - $2,972.
A breakdown below $2,968 could lead to $2,955.
Happy Trading!
Note: This analysis is for educational and informational purposes only and should not be considered financial advice. Trading in Forex, commodities, and indices involves a high level of risk and may not be suitable for all investors. Before engaging in live trading, ensure you have a clear risk management strategy and consult a licensed financial advisor if necessary. You are responsible for your trading decisions.