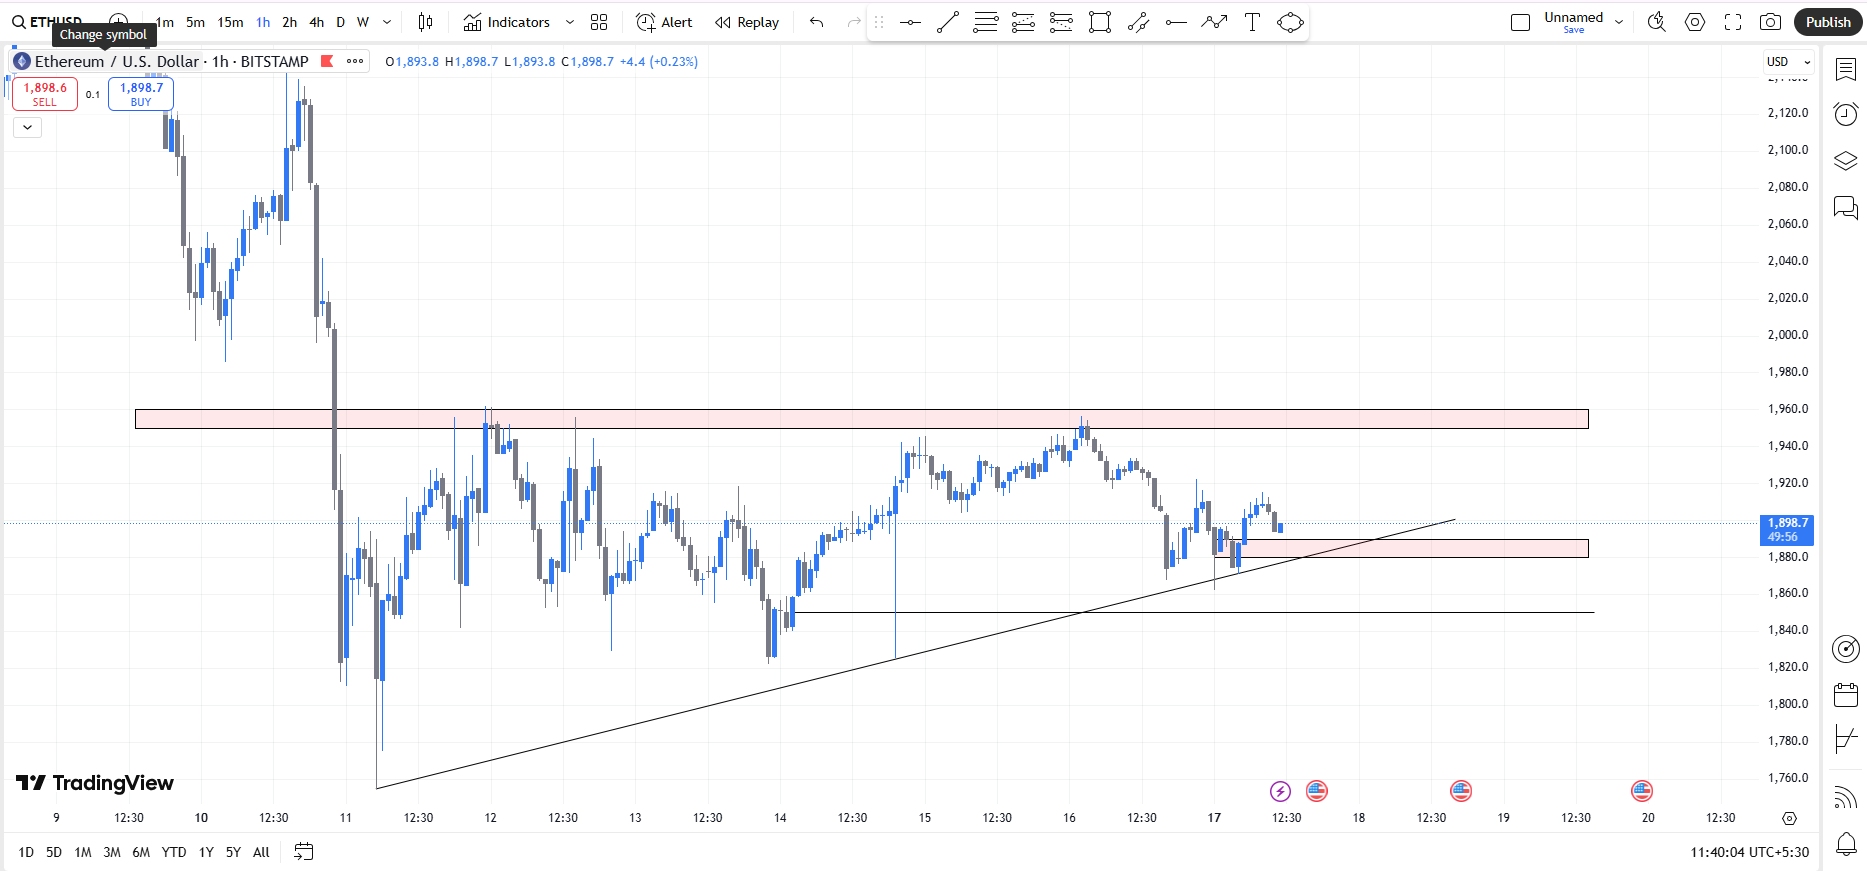
ETHUSD (1H Chart)
Analysis :
Market Structure
- Ascending Triangle Formation :ETH is forming higher lows while facing resistance near $1,959.
- Bullish Bias : The price is respecting the rising trendline, indicating buyers are stepping in at higher levels.
- Key Resistance Area (Red Zone) :Around $1,950 - $1,960, price has faced multiple rejections.
Key Levels to Watch
Support Levels (Demand Zones)
$1,880 - $1,890 → Immediate support at the rising trendline.
$1,850 → Stronger support; if trendline breaks, ETH may test this level.
$1,820 → If ETH drops further, this would be a major support area.
Resistance Levels (Supply Zones)
$1,950 - $1,960 → Strong resistance; ETH needs to break above for bullish continuation.
$2,000 Psychological Level → If ETH breaks above $1,960, $2,000 is the next key target.
Bullish Breakout (High Probability)
If ETH breaks above $1,960 with strong volume, expect a move toward $2,000 - $2,020. Confirmation: A strong bullish candle closing above resistance.
Bearish Breakdown (Medium Probability)
If ETH breaks below the ascending trendline (~$1,880), it could drop to $1,850 or $1,820. A bearish confirmation would be a strong close below $1,880.
Happy Trading!
Note: This analysis is for educational and informational purposes only and should not be considered financial advice. Trading in Forex, commodities, and indices involves a high level of risk and may not be suitable for all investors. Before engaging in live trading, ensure you have a clear risk management strategy and consult a licensed financial advisor if necessary. You are responsible for your trading decisions.